Wireshark Features
Live capture, deep dissection, display filters, and statistics for troubleshooting, security review, and documentation—without leaving the trace file.
3,000+Protocols
Live & offlineCapture
GPLOpen source
Overview
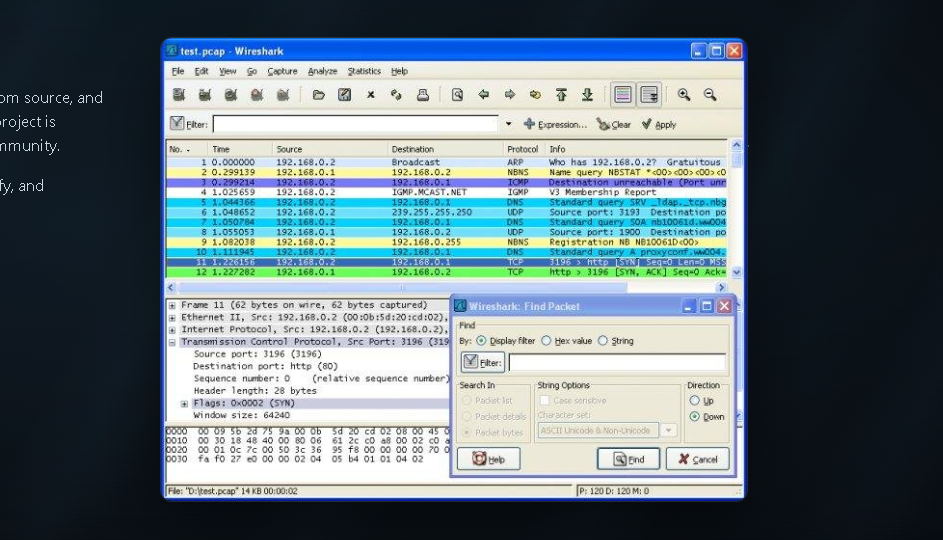
Wireshark turns raw frames into a structured protocol tree. Use one workspace for capture, filtering, stream reconstruction, and export—on Windows, macOS, and Linux.
- Three-pane layout: packet list, detail tree, and hex dump stay in sync
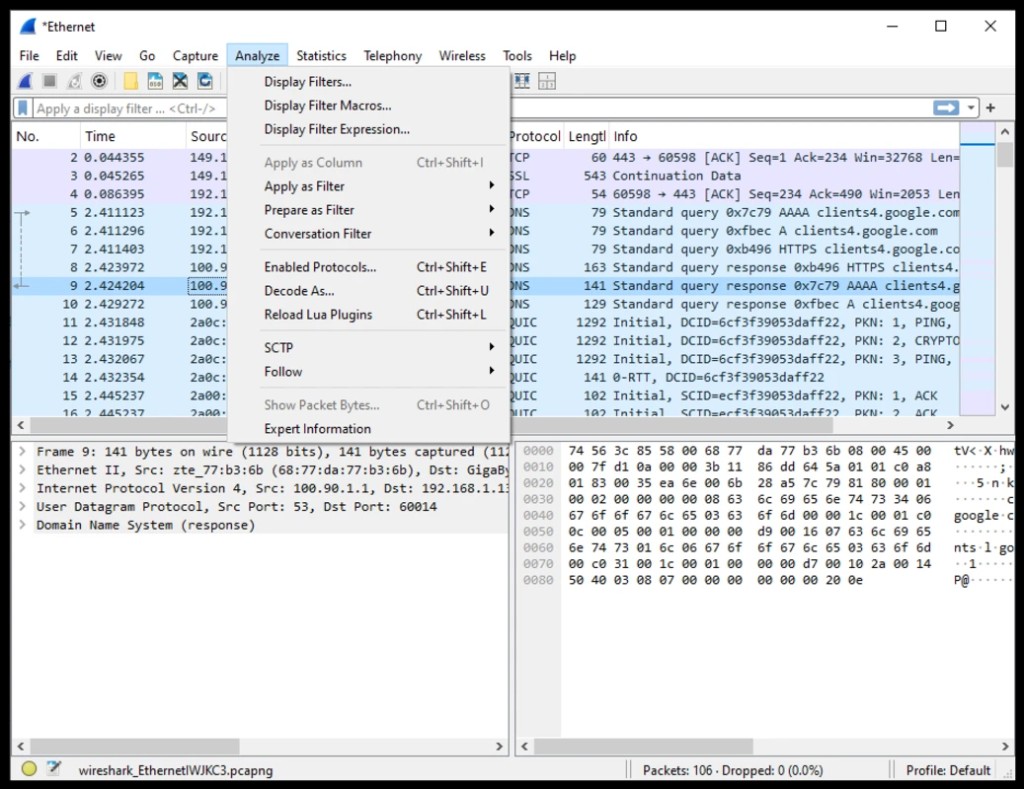
- Display filters narrow millions of frames without re-capture
- Expert Information flags retransmits, errors, and anomalies
- GPL-licensed; full analyzer, not a limited demo
Packet & Protocol Inspection
Core capability
Decode every layer
- Dissectors for Ethernet, IP, TCP/UDP, TLS, DNS, HTTP/2, VoIP, and more
- Filters such as
tcp.port == 443andhttp.request - Follow Stream rebuilds TCP, TLS, and HTTP conversations
- Find Packet: string, hex, regex, and display-filter search
Live Capture & Monitoring
Real-time
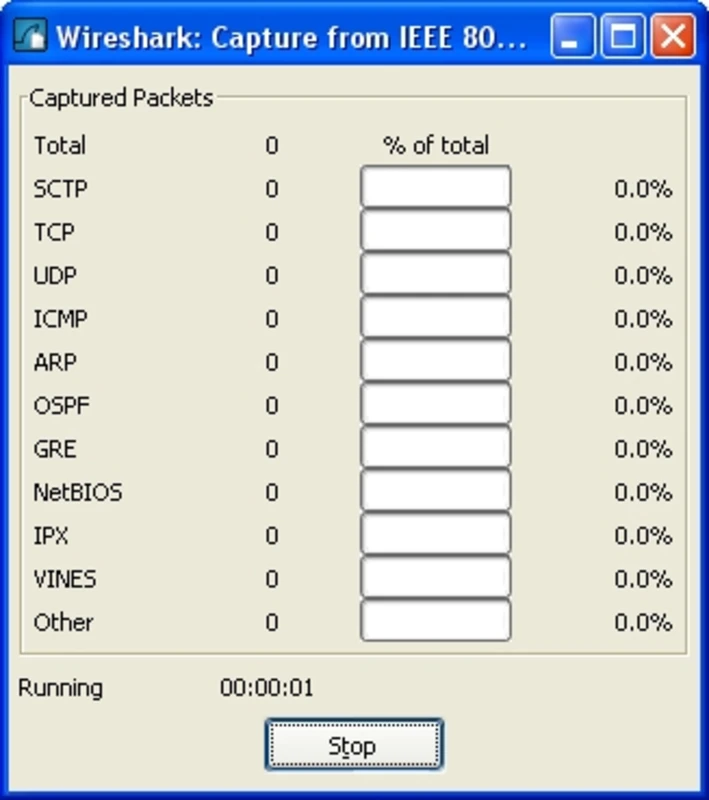
Watch traffic as it arrives
- Capture on wired, wireless, or virtual adapters
- BPF capture filters reduce noise before packets hit disk
- Remote capture via SSH or dedicated agents
- Merge, export, and anonymize PCAP/PCAPNG files
Interface & Capture Permissions
Platform
Adapters & drivers
- Npcap on Windows; libpcap on Unix-like systems
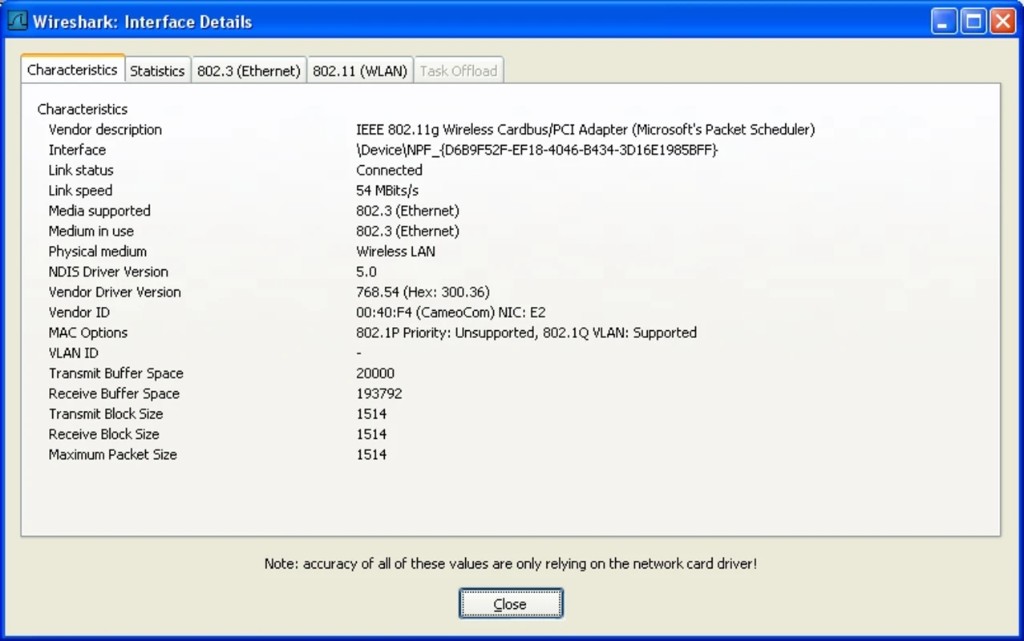
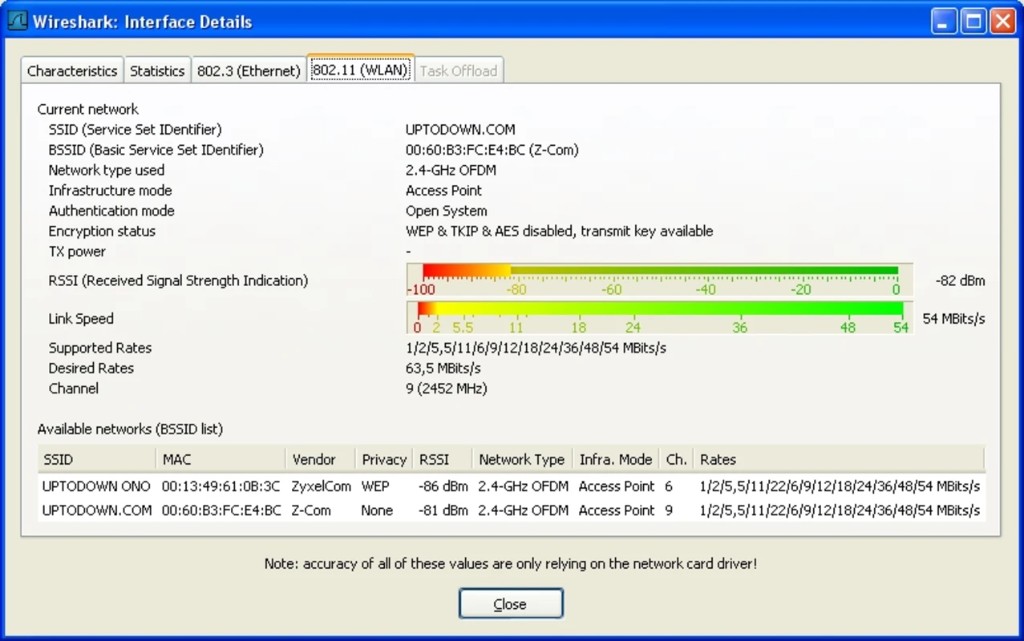
- Interface Details shows driver version and link speed
- Promiscuous mode depends on adapter and OS rights
- Grant capture permissions per our setup guide
Wireless Telemetry
Wi‑Fi
RF-aware analysis
- RSSI, rates, and channel data on supported adapters
- Protocol Hierarchy and Conversations by peer
- IO Graphs for throughput, RTT, and retransmissions
- Export stats for reports and capacity planning
Layout, Profiles & Plugins
Customize
Profiles & extensions
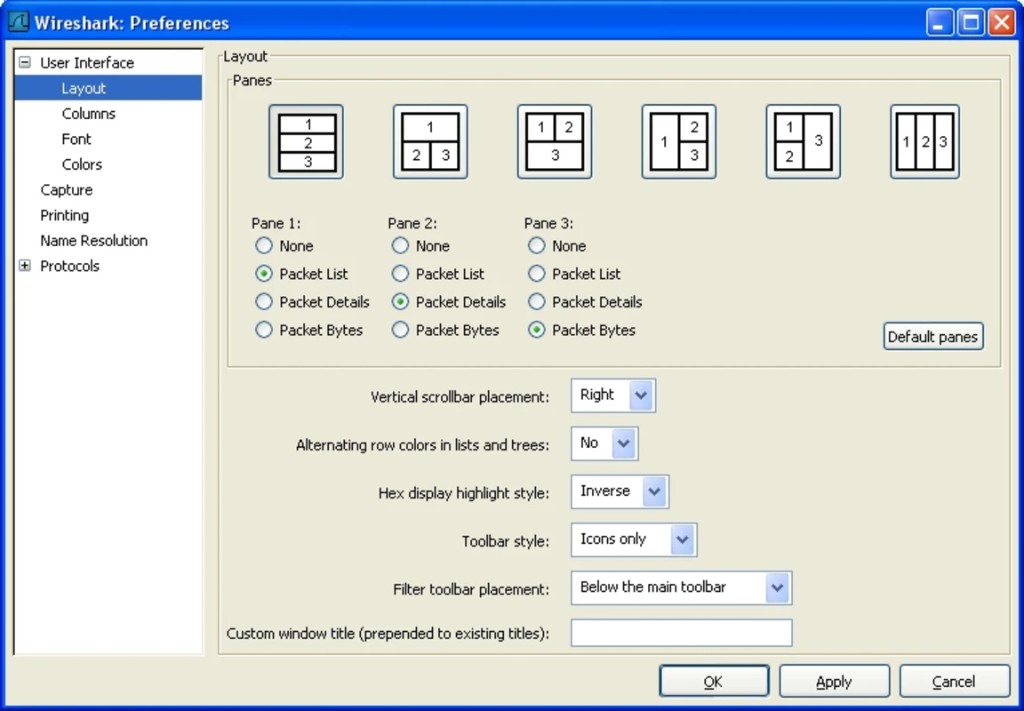
- Arrange packet list, details, and bytes panes per preset
- Coloring rules and custom columns per profile
- Lua scripts for menus, taps, and automation
- C/C++ dissector plugins and Decode-As for unknown ports
Search, Filters & Workflow
Investigation
Find, mark, navigate
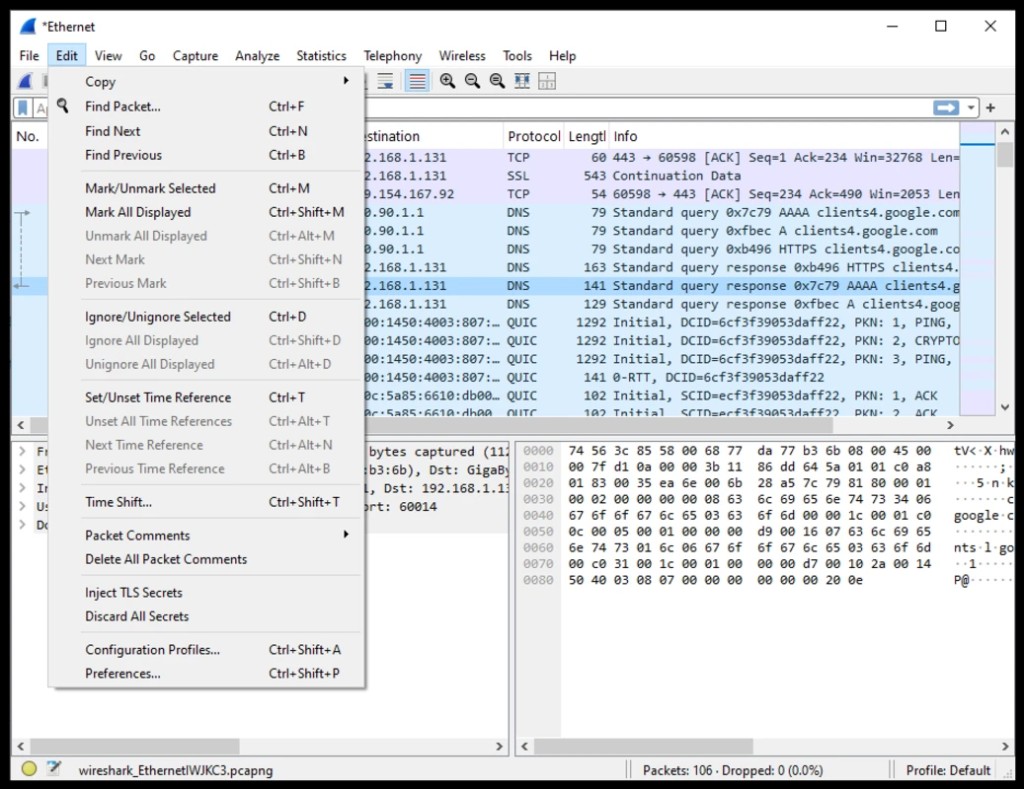
- Find Packet with display-filter, hex, and regex modes
- Mark packets and set time references in large captures
- View menu: time format, name resolution, pane visibility
- Combine Analyze filters with saved display profiles
Getting Started
First launch
Capture or open a file
- Pick an interface or open an existing PCAP
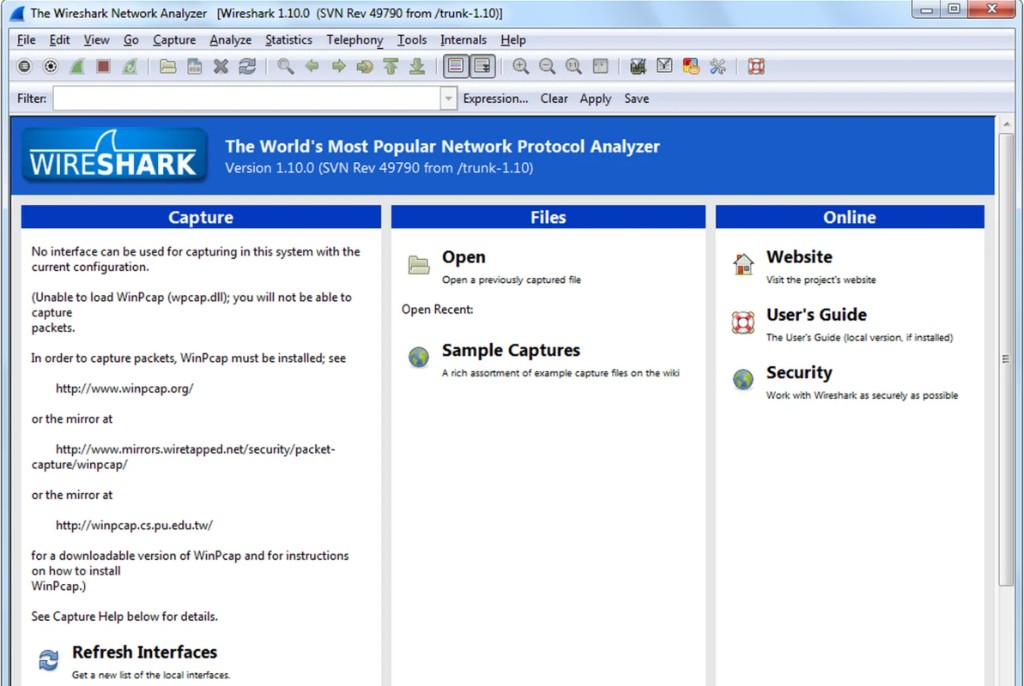
- Sample captures and documentation links on the welcome screen
- Inline tips when Npcap or permissions are missing
- Filter bar ready as soon as a trace loads
Ready to capture your first trace?
Install Wireshark, choose an interface, and save a PCAP in minutes.