跳转到主要内容

指南教程

Wireshark

wire-shark.com — 安装与入门

English · Русский · 简体中文 · العربية · Español

下载
Troubleshooting

Wireshark Guides

Step-by-step solutions for capture problems, display filters, performance tuning, and security software conflicts.

First Capture Walkthrough

  1. Install Wireshark and accept Npcap on Windows when prompted for live capture support.
  2. Launch Wireshark. Select the active interface (often Wi-Fi or Ethernet) showing traffic sparklines.
  3. Click the blue shark fin to start capture. Generate test traffic by opening a browser page.
  4. Click the red square to stop. Apply a display filter such as http to isolate web traffic.
  5. Save the file as a .pcapng for later analysis or sharing with your team.
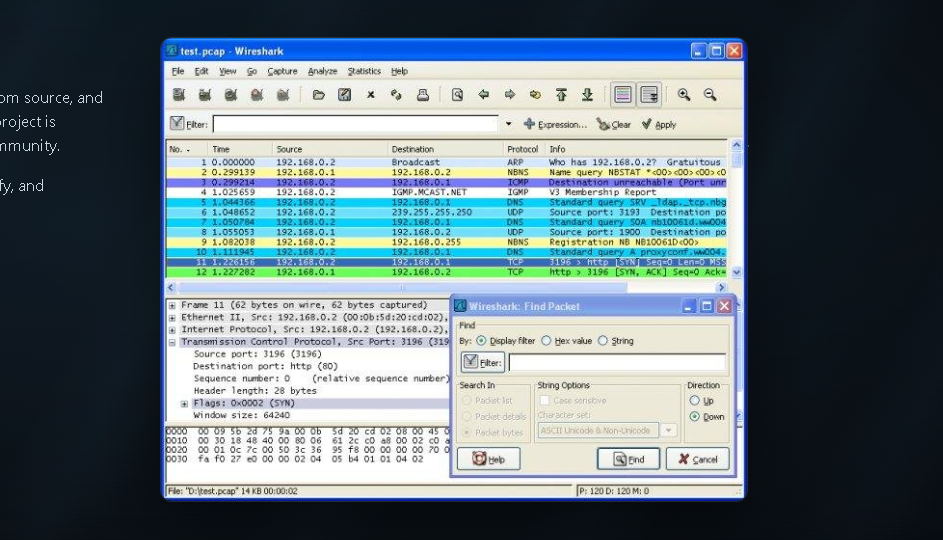
Wireshark workspace with packet list and detail panes
Main workspace — packet list, dissection, and hex panes

No Interfaces Listed

If the interface list is empty, the capture service is not installed or lacks permission.

Windows

  • Reinstall Npcap from the Wireshark installer option.
  • Run Wireshark as Administrator once to test.
  • Disable conflicting VPN capture drivers temporarily.

Linux

  • Install wireshark and wireshark-common packages.
  • Add user to wireshark group: sudo usermod -aG wireshark $USER then log out and back in.

Capture Permissions

Promiscuous mode captures all frames visible on the segment, not only those addressed to your NIC. Some switches restrict promiscuous mode on ports.

On corporate laptops, group policy may block driver installation. Request IT approval for Npcap or use portable capture on an approved mirror port.

Display Filters

Display filters affect only the view, not what was captured. Enter expressions in the toolbar filter box.

ip.addr == 192.168.1.1
tcp.port == 443
http.request.method == "GET"
dns.qry.name contains "example"

Green background means valid syntax. Red means fix the expression before applying.

Large Capture Performance

  • Use capture filters to limit traffic during collection (example: host 10.0.0.5).
  • Enable ring buffer with multiple files for long-running captures.
  • Close unrelated applications when opening multi-gigabyte traces.
  • Split large files with editcap or the File menu split tools.

Profiles & Best Practices

  • Profiles: Create separate profiles for VoIP, HTTP, and security work with custom columns and coloring rules.
  • Documentation: Note capture time, interface, and filter used when sharing traces.
  • Privacy: Redact sensitive payloads before exporting captures outside your organization.
  • Authorization: Capture only networks you own or have written permission to monitor.

Still have questions?

Visit the FAQ or download the latest stable build to start capturing.